44.98722°N, -93.25444°W — based in Northeast Minneapolis

I turn raw spatial data into decisions people can act on.

Geospatial analyst working across QGIS, PostGIS and Python. I build reproducible notebooks for land cover classification, hydrology, and urban growth modeling — then package the findings so planners and non-technical stakeholders can actually use them. Most weekends I'm out testing the terrain myself, on foot or by kayak.

Ajalon Peterson
fig. 01 Olympic National Park, WA

Selected work

A case study, plus three recent projects spanning remote sensing, hydrology, and municipal planning.

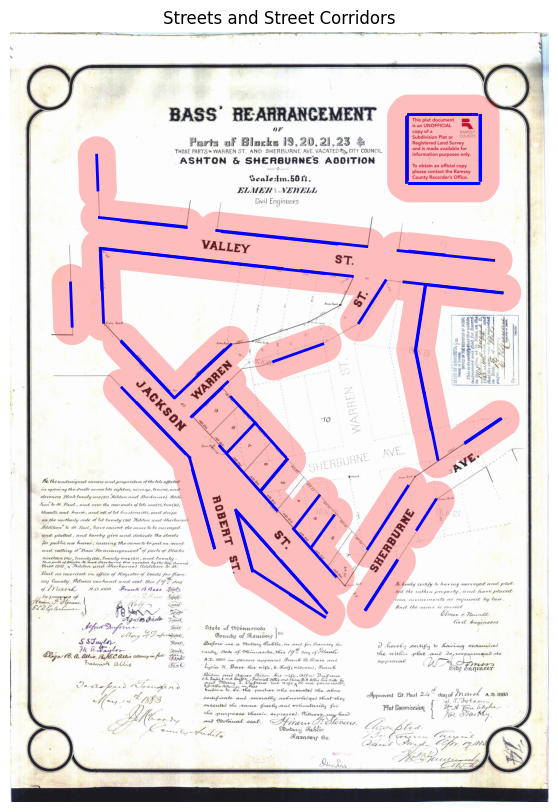
Street buffer corridors overlaid on a historical plat map
case study, GEOG 5543

Predicting modern locations from a 1930s plat map, using OCR and a street buffer

A scanned plat has no coordinates and handwriting that runs in every direction. This walks through using an ordinary GIS buffer to narrow an OCR problem, then matching what's left against the modern street network.

read the case study
land cover, thermal bands
Urban Heat Island Mapping
Landsat 8 thermal bands + NDVI regression to flag heat-vulnerable neighborhoods for a county planning office.
rasterioscikit-learn
hydrology, DEM analysis
Watershed Delineation Tool
Automated flow-direction and pour-point analysis from DEM tiles, packaged as a reusable QGIS plugin.
whiteboxPyQGIS
transit, network analysis
Bus Route Accessibility Score
Network analysis measuring walk-time gaps to transit stops across census block groups.
networkxgeopandas

Python notebooks

Documented and reproducible. Clone any of these and point them at your own AOI or dataset.

ndvi_timeseries.ipynb
import geopandas as gpd
import rioxarray as rxr

# load and clip Sentinel-2 stack to AOI
aoi = gpd.read_file("aoi.geojson")
stack = rxr.open_rasterio("s2_stack.tif")
clipped = stack.rio.clip(aoi.geometry)

ndvi = (clipped.nir - clipped.red) / (clipped.nir + clipped.red)
ndvi.plot(cmap="RdYlGn")

NDVI Time Series

Five-year vegetation trend across a reservoir watershed

view on GitHub
parcel_risk_model.ipynb
from sklearn.ensemble import RandomForestClassifier

# features: slope, distance to floodplain, soil class
X = parcels[["slope", "fld_dist", "soil_k"]]
y = parcels["flood_flag"]

clf = RandomForestClassifier(n_estimators=300)
clf.fit(X, y)
parcels["risk_score"] = clf.predict_proba(X)[:,1]

Parcel Flood Risk Model

Classifier scoring 40k parcels for a resilience grant application

view on GitHub
isochrone_access.ipynb
import osmnx as ox
import networkx as nx

# pull walk network, build 15-min isochrones
G = ox.graph_from_place("Eau Claire, WI", network_type="walk")
centers = gpd.read_file("clinic_sites.geojson")

for pt in centers.geometry:
  node = ox.distance.nearest_nodes(G, pt.x, pt.y)
  subgraph = nx.ego_graph(G, node, radius=900)

Clinic Access Isochrones

15-minute walk-access sheds around rural clinic sites

view on GitHub
lulc_classifier.ipynb
import ee
ee.Initialize()

# composite + classify a Sentinel-2 scene in GEE
img = (ee.ImageCollection("COPERNICUS/S2_SR")
  .filterBounds(aoi).filterDate("2025-06-01", "2025-09-01")
  .median())

classified = img.classify(trained_clf)

Land Use / Land Cover Classifier

Random forest classification over a growing-season composite

view on GitHub

About

Background, tools, and how I like to work.

I'm a recent graduate of the University of Minnesota, with a B.S. in Geography (GIS) and Plant Science. I focus on the Python side of GIS — automating workflows to streamline tasks that would otherwise mean a lot of manual digitizing.

My background spans both plant science and GIS, which gives me a toolset for tackling large-scale spatial problems with real scientific grounding behind them — not just the geometry, but why it matters ecologically.

Outside of work I'm usually spending time enjoying what sparked my interest in this field in the first place — the great outdoors. Hiking, kayaking, and plant identification along the way make me feel more in tune with the landscape, and with myself.

PythonRSQLArcGIS ProArcGIS OnlineArcPyGoogle Earth EngineQGIS
Download resume (PDF) full work history, coursework, and publications
2
peer-reviewed publications contributed to
8
solar facilities surveyed for ecological impact
3
Dean's List terms
10+
point tree-equity gain targeted, Faribault forestry plan

Have a dataset that needs a map, a model, or both? Let's talk.